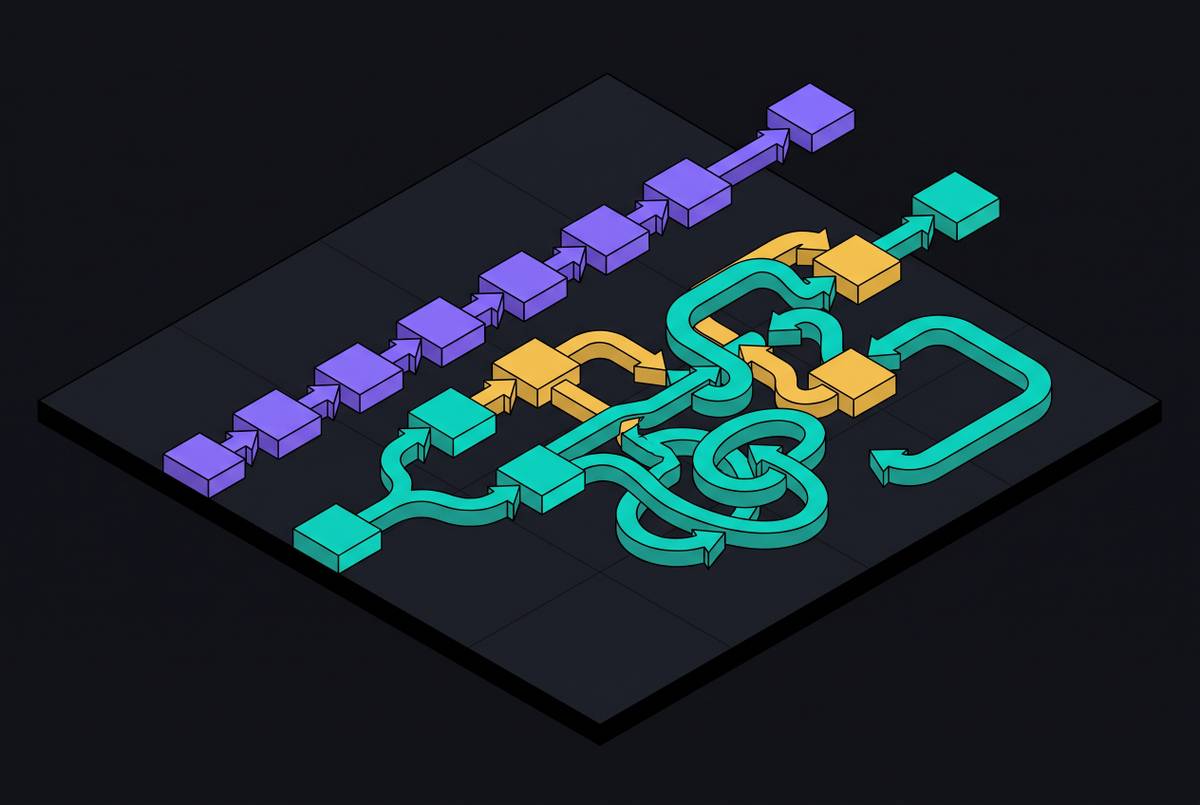
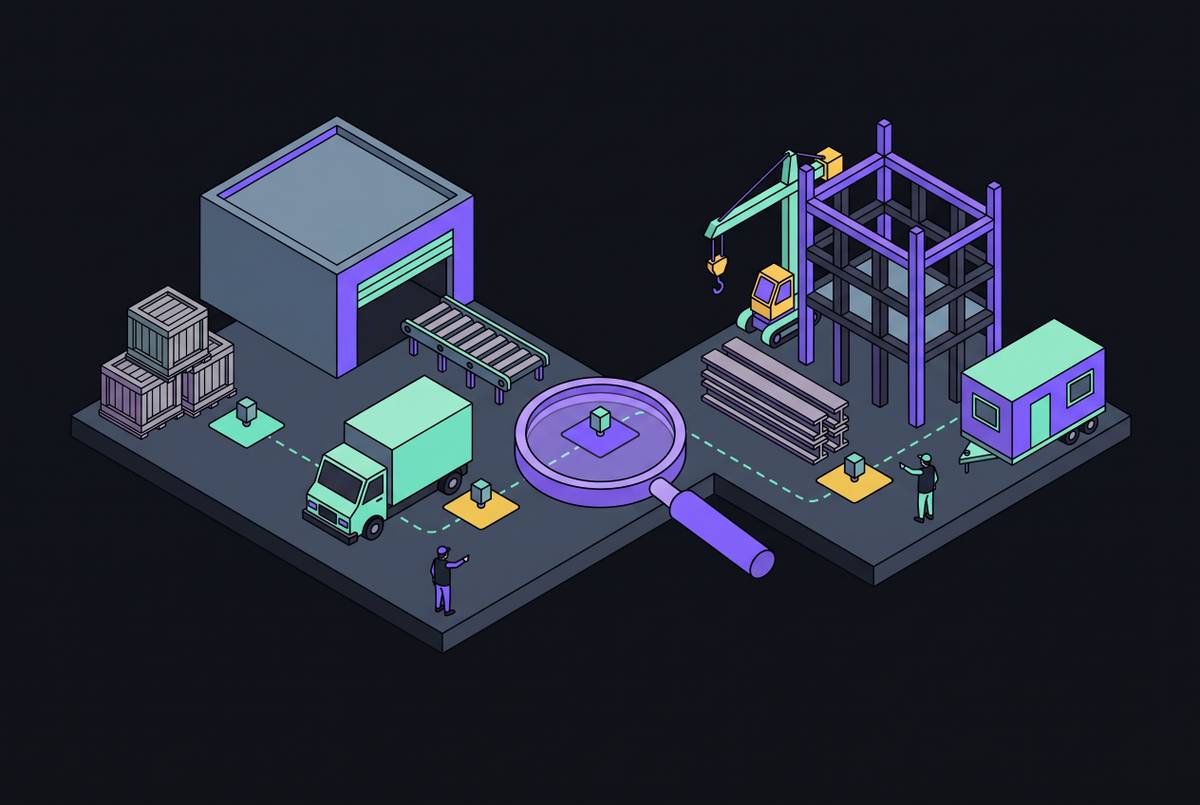
Repair Signal vs. Automation Signal How Operations Data Tells You Which Category a Process Falls Into
Distinguish repair signals from automation signals before deploying AI.
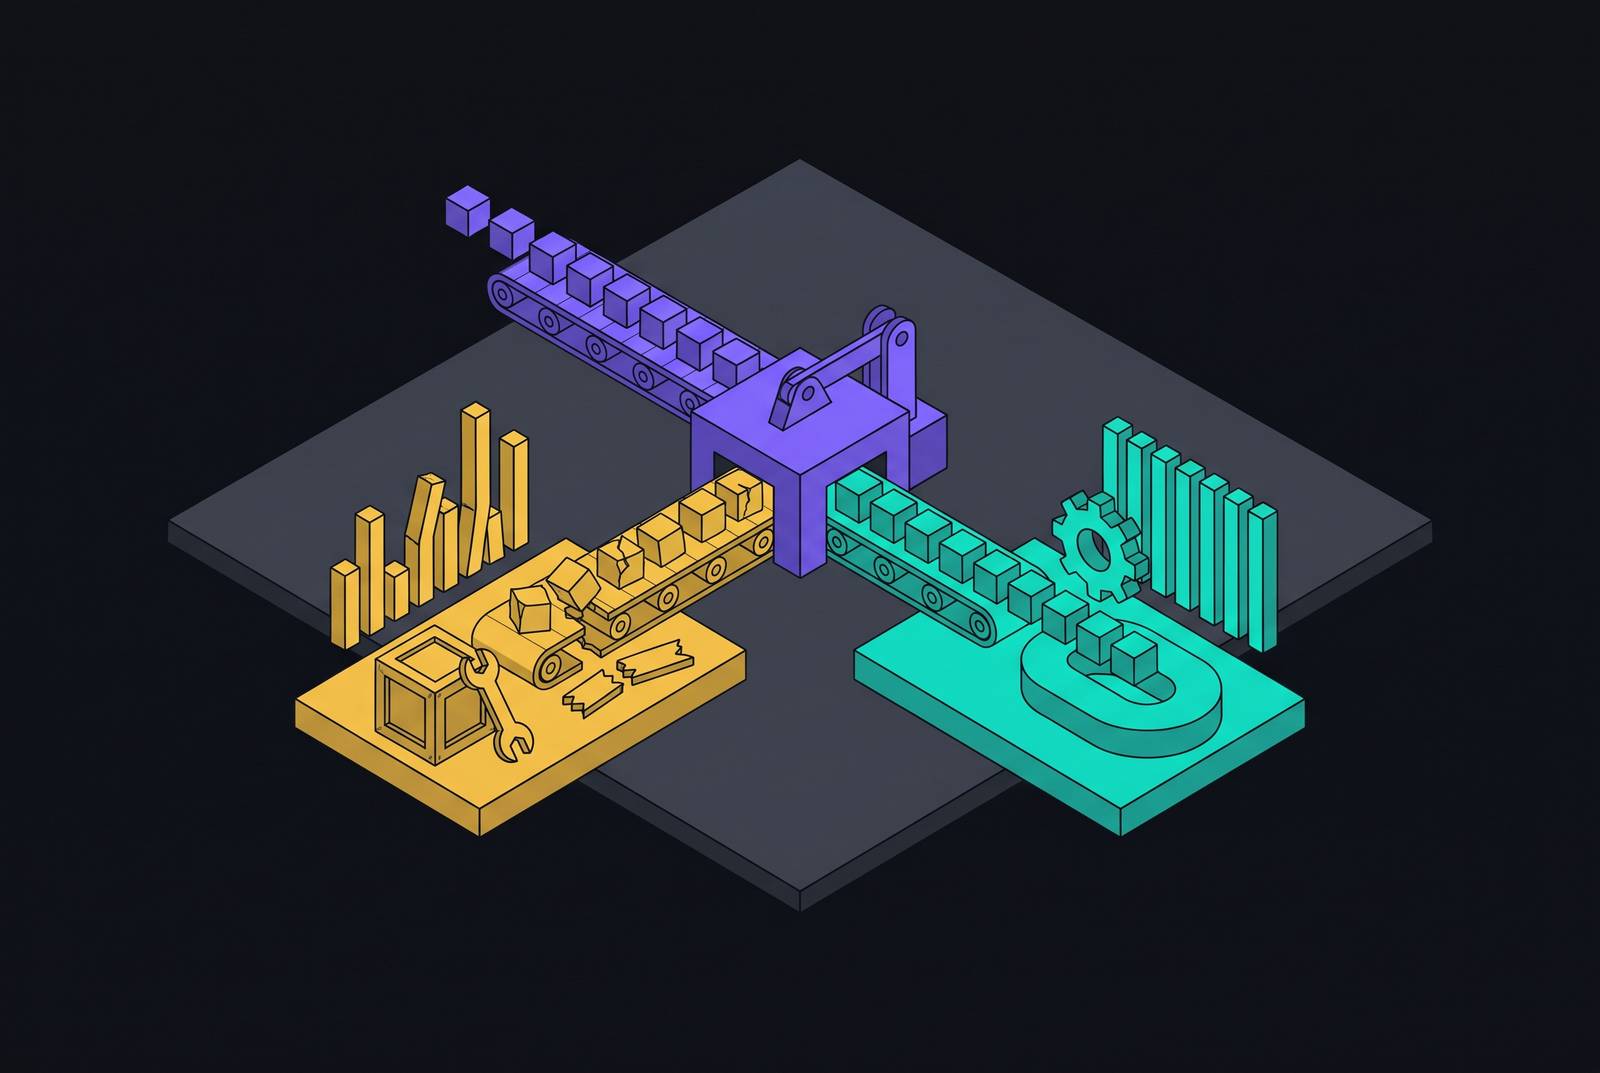
Before deploying AI in construction or logistics operations, a process audit must distinguish repair signals from automation signals. Repair signals expose structural defects in how work is defined and controlled, while automation signals show stable work constrained mainly by human execution time. Repair signals call for the next investment to rebuild a process, while automation signals call for it to automate a narrowly defined part of that process.
Why operations data doesn't tell you one thing — it tells you two different things
A process map declares that an approval controls a decision. The transaction log may show delays followed by almost no rejections, while field behavior reveals that approval is treated as a formality. A scheduled reconciliation may similarly leave differences unexplored. Documentation is not evidence of an effective process. Repair signals begin where the controls on paper differ from how the work gets done.
Automation signals arise from a different operating condition, where the process produces dependable results but waits on people to execute repeatable steps. Confusing these conditions is the central misclassification behind most failed automation deployments. Automation accelerates the process as it operates in practice. Autodesk's 2025 construction spotlight found that only about a third of construction leaders say they have met or are close to meeting their AI goals. That finding is consistent with widespread misclassification, although it does not establish the cause of those shortfalls.
What a repair signal actually looks like in the data
Repair signals appear in transaction data, system records, and field behavior when the definition or enforcement of a process is defective. High approval-delay rates paired with low rejection rates are one signature. The gate consumes time without catching errors. High retry and rework volume concentrated at the same handoff is another, because repeated recovery at one point indicates a structural failure. The location of the repetition is more revealing than the total transaction count.
Bypass behavior is a third signature: users complete steps through email, spreadsheets, or phone calls without leaving a system record. These workarounds create invisible decisions and phantom approvals. A fourth signature appears when the cost of a completed outcome is disproportionate to the cost of an individual step. A cheap step can trigger corrections, escalations, and rework tickets downstream because it makes decisions it cannot reliably make.
Construction submittals make these patterns concrete through long approval cycles and an accumulating backlog. Together, those conditions point to review capacity or decision authority. Procurement opacity presents a related repair signal. When system records cannot show whether materials will arrive on time, whether substitutions are needed, or how a delay affects downstream work, the process leaves people without the information they need to make decisions. More throughput cannot resolve that missing visibility.
What an automation signal actually looks like in the data
An automation signal appears when consistent, predictable outcomes occur at high volume and human execution time is the main bottleneck. Low variance in outcome quality across operators and shifts is one signature. Success does not hinge on one person's judgment. Another appears when handoff time, rather than error correction or rework, dominates cost.
High volumes of structurally identical transactions provide a third signature because the work follows a repeatable template. Repetition alone, however, is not enough for classification. The fourth signature is the presence of defined, working stop rules, including maximum retries, escalation conditions, and exception routing. These controls show that the process has been hardened for departures from normal execution. Its suitability rests on predictable behavior within those limits.
In construction operations, routing and tagging RFIs or flagging ageing submittals can fit this category when volume is high and decision logic is well-defined. The upstream process must already be stable. Otherwise, faster routing merely moves unresolved defects to the next participant. Ron Arana of Arana Group describes AI's value as shifting teams from processing information to making decisions. That shift depends on separating genuinely repeatable information processing from work whose apparent simplicity hides unresolved judgment.
Why the two signals are easy to confuse and what makes the confusion dangerous
Both signal types can appear as high volume, repetitive steps, and measurable throughput on a dashboard. Those surface features describe activity. A process generating many transactions can therefore look ready for automation even when much of that activity consists of retries or rework.
The consequences extend beyond wasted effort because automation amplifies the behavior already present. Phantom approvals become faster phantom approvals, while bypassed controls can spread without people informally catching some of the problems as they did before. Missing stop rules compound the exposure. Without limits on retries, spending, or records touched, classification drift can propagate through connected systems before anyone detects it.
Even when the data looks stable, the organization may be unable to support production agent behavior. Incentives, oversight capacity, and decision authority must support the process, or an agent can behave correctly while the operation fails. Judd Fuoto of Southland Industries argues that AI for construction is still too early in its training to fulfill big promises. That skepticism identifies a real deployment risk, but an immature receiving process can explain failure more precisely than a categorical judgment about technology readiness.
The five data dimensions that reliably distinguish the two signals before you commit
The first dimension combines handoff time with retry volume. Long waits alone do not identify the bottleneck. High handoff time with low retry volume points toward work waiting for human execution, whereas high handoff time with repeated retries at the same step points toward recovery from a structural defect. Reading the measures together separates idle time from repair time.
The second dimension looks at approval gate concentration alongside the rejection rate. A single gate blocking many downstream tasks may be a correctly designed control point. High delay paired with very low rejection suggests that the gate adds latency without performing its control function. By contrast, substantial rejection and revision activity indicates that the gate is doing real decision work, even if the submissions reaching it need repair.
The third dimension compares the cost per completed outcome with the cost per step. A cheap transaction can lead to costly fixes elsewhere. Total execution cost per completed business outcome exposes those downstream costs rather than treating the triggering step as an isolated success. This matters most when a proposed automation promises to make each action cheaper or faster.
The fourth dimension looks at whether stop rules are in place and what they cover. Defined maximum retries, escalation conditions, and human handoff triggers indicate operational hardening only when they work in practice. Written limits alone are not sufficient evidence. Their coverage must also extend to the exceptions the process needs to contain, including limits on spending or records touched where relevant. A process without working stop rules is not ready for automation, however stable its routine transactions appear.
System records and field behavior must support what the process map says happens. Offline completion exposes a break in that alignment. Where informal channels substitute for recorded decisions, the documented sequence cannot serve as a reliable automation specification. Reading this dimension with the other four prevents a clean-looking system record from being mistaken for a complete account of the work.
How energization readiness in construction illustrates all five dimensions at once
Electrical energization readiness often appears on a project schedule as a single milestone. The operating process is considerably less compact. Utility coordination, load studies, facility studies, and service agreements each involve handoffs, with high retry rates when submissions are incomplete or requirements change. The resulting delays are not simply time that automation can remove, because some of that time is spent recovering from defective or changing inputs.
Utility approval illustrates why the second dimension requires careful interpretation. It is one gate that blocks downstream electrical commissioning, but high rejection and revision rates show that it performs a substantive control function. This is not a ceremonial approval bottleneck. The repair signal lies in the coordination and submission process. Automating away that gate would confuse necessary scrutiny with avoidable delay.
Outcome cost makes the classification more consequential. A missed energization can cause a full schedule slip, while transformer lead times running into years mean that failed coordination cannot simply be recovered through expediting. A blended date conceals this exposure. The stop-rule dimension shows another weakness, because most project schedules have no defined escalation condition for when utility application milestones slip. Without that trigger, drift can remain undetected until recovery is no longer available.
Field alignment exposes what the blended milestone omits. The actual sequence requires separate milestones for utility application, load study, facility study, service agreement, equipment order, factory acceptance testing, delivery, installation, energization, and commissioning. One date does not describe that decision sequence. The appropriate repair is therefore to rebuild energization tracking at a granularity that matches the actual work. Kassem Ben Abid of BESIX notes that AI is becoming indispensable but is still not fully structured. In energization readiness, the diagnostic evidence identifies a lack of process structure before any technology choice can address it.
What should a team do with the classification before deploying AI automation?
A team seeing mostly repair signals should start with a process audit that checks the work on paper against evidence of how it gets done. The target is the specific step where retry volume, bypass behavior, or outcome cost concentrates. Scope is part of the diagnostic discipline. The audit's output is a rebuilt process definition with decision authority, input standards, and stop rules established before automation is considered. A tool evaluation or AI pilot does not substitute for that work.
Where automation signals dominate, the next action is to scope deployment around stable, high-volume steps with well-defined logic. Stop rules already in place help show readiness, while stop rules and escalation conditions for the deployment must be set before launch. They are not additions for after the first failure. Cost per completed business result takes the place of step-level throughput as the measurement baseline.
A stable routing step may be ready for automation even while an approval or procurement decision next to it needs repair. Classifying the whole process as one unit obscures both opportunities. An operations firm that starts with a process audit has a defined role here, connecting system evidence and field behavior to a scoped intervention. The starting point remains a specific, painful process where the data reveals a concrete problem. The smaller and more explicit that starting point, the more defensible the classification and the faster the first result.